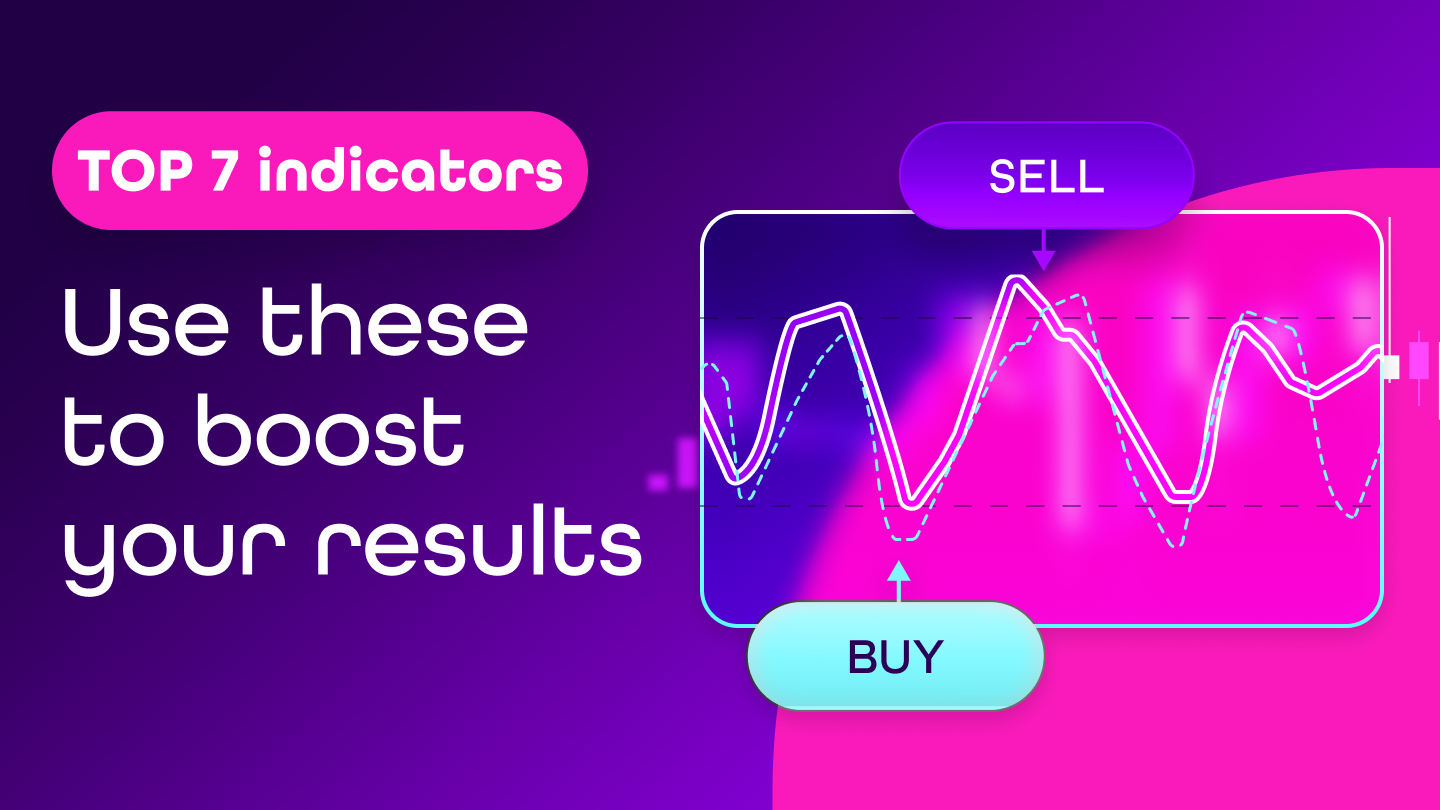
Top 7 indicators for day trading even a beginner can master
Discover 7 proven trading indicators to help you read the market, catch better entries, and improve your results. Clear, simple, and no fluff.

Imagine you’re about to place your first trade. You open the chart—and all you see is chaos. Prices flying, candles flashing, and no idea what to do next. You’re missing a sense of direction. Something to bring order to the mess.
Trading indicators won’t tell you exactly what’s going to happen, but they help you make better, more confident decisions. When you know how to use them, you gain an edge. If not, you’ll end up clicking randomly and hoping for the best.
In this article, you’ll learn:
- which indicators are best for day trading,
- how they work and when to use them,
- and how to build your own trading system around them.
What are indicators and why we categorize them
An indicator is a mathematical calculation based on market data—usually price, volume, or time. On the chart, it appears as a line, band, or plotted point. Its goal isn’t to “predict the future,” but to help you understand what’s happening on the market right now.
Put simply: Indicators show you when the market is strong, weak, fast, slow, or overextended. And that helps you better time your entries and exits.
The main types of indicators
- Trend indicators – Show the direction and strength of the market trend. Help answer the question: “Is the market going up, down, or moving sideways?” (e.g. moving averages (SMA, EMA), ADX).
- Oscillators – Work best in sideways or ranging markets. They signal when the market is overbought or oversold, which can hint at a reversal (e.g. RSI, Stochastic Oscillator, MACD).
- Volume indicators – Track how much is being traded. The higher the volume, the more “serious” a price move is likely to be (e.g. Volume, On-Balance Volume (OBV), VWAP).
- Volatility indicators – Show how wild or calm the market is. More volatility means higher risk—but also bigger profit potential (e.g. Bollinger Bands, ATR.
💡 Fintokei tip
Getting lost in all the terms? Start by learning the basics of trading terms.
Top 7 best indicators for day trading
Not every indicator is right for everyone. Some work great in trends, others in calm, ranging markets. Choose based on your style—and most importantly, learn to observe before you rely on them.
Moving averages (SMA, EMA)
One of the simplest but most-used indicators. It averages price over a set period and helps reveal the market’s direction.
- SMA (Simple Moving Average): classic average, smooths the chart
- EMA (Exponential Moving Average): more sensitive to recent moves
What’s it good for? Filtering noise, confirming trend, defining support/resistance.
💡 Fintokei tip
Watch for crossovers between short and long MAs—called a “golden cross” or “death cross.”
RSI (Relative strength index)
An oscillator showing whether the market is overbought (above 70) or oversold (below 30).
- Pro: Helps spot market reversals, even short-term ones
- Con: Can give false signals during strong trends
💡 Fintokei tip
Combine with a trend indicator (like EMA) to know when to ignore it.
MACD (Moving average convergence divergence)
A combo of moving averages showing whether the market is gaining or losing momentum.
- Signals: MACD crossing the signal line, or crossing the zero line
- Use: Spotting trend reversals, tracking momentum
💡 Fintokei tip
MACD lags behind price—use it more for confirmation than entry.
Stochastic oscillator
Shows where the price is closing relative to its recent range.
- Pro: Great for consolidation zones—ideal for scalping
- Con: Often gives false reversals in trending markets
- Use: Look for %K and %D crossovers in extreme zones.
Bollinger bands
Three lines around a moving average: middle, upper, and lower band. They track volatility.
What they show: When price breaks a band, it may soon revert. They are best for spotting extremes and potential mean reversions
Watch out: A breakout doesn’t always mean a reversal—check volume too.
Volume indicators (Volume, OBV, VWAP)
Basic volume shows how much is traded. OBV adds context, VWAP shows a “fair value” price.
- Why it matters: Rising price + rising volume = strength
- Great combo: Use volume to confirm price action or other indicators.
Supertrend
Simple trend-following indicator that changes color based on market direction.
- Pro: Clear visual guide, great for beginners
- Con: Not ideal for ranging markets
💡 Fintokei tip
Combine with EMA and RSI for a simple and reliable 3-part system.
How to choose the right trading indicator for you
It’s not about finding “the best” indicator—it’s about finding one that fits you—your pace, your mindset, your style. Ask yourself:
- Do you trade fast? → Try Stochastic or Supertrend
- Are you more patient and analytical? → Go with EMA or MACD
- Prefer to keep things simple? → Combine 2–3 basics like RSI + Volume
Recommended combos
- EMA + RSI – clean trend-following system
- MACD + Bollinger Bands – great for reading market phases
- Supertrend + Volume – clear signals backed by activity
💡 Fintokei tip
Don’t use more than 2–3 indicators at once. The simpler the setup, the easier it is to evaluate and trust.
Common mistakes to avoid
- Overloading your chart: If you’ve got RSI, MACD, Bollinger Bands, Supertrend, and three custom scripts all running… you’re seeing everything—and nothing. Stick to a maximum of three indicators you understand and use consistently.
- Ignoring price action: Your indicator says one thing, but price says another. Many traders follow signals blindly without watching what the market is actually doing. Use indicators to confirm—not control—your decisions. Always watch candles, support, and resistance.
- Wrong time frame: Some indicators perform better on higher time frames, others on lower. Beginners often stick to M1 or M5 and overreact. If unsure, use M15 to H1—more stable and easier to read.
- Thinking indicators = entry signal: Many traders jump in just because “something crossed something.” That’s not a system. Look for confluence—trend + overbought/oversold + volume, for example.
How to test indicators without getting burned
Start with a free trial challenge
That’s your training ground. No need to go straight into a paid challenge. Just test indicators with zero risk. Play with settings, observe what actually makes sense. With a Free Trial, you’ve got 1 run in the first evaluation phase of any Fintokei program. Overall, you can have 3 Free Trial accounts.
💡 Fintokei tip
TIP: Try free trial demo trading with Fintokei.
Keep a trading journal
Write down when and why you entered, which indicators you used, what happened next, what you’d do differently next time. After 10–20 trades, you’ll see patterns and find out if that indicator really fits you.
Use backtesting
See how the indicator behaved in the past. It won’t predict the future, but it gives you a good idea of how it reacts in different market conditions.
Evaluate the system, not the single trade
If your first few trades fail, that doesn’t mean the indicator is bad. Focus on the overall performance—win/loss ratio, drawdown, consistency.
💡 Fintokei tip
Even with a solid system, emotions can sneak in. Learn more about trading psychology and how to stay in control.
FAQ
What are the best indicators for day trading?
Some of the most popular and reliable ones are EMA, RSI, MACD, and Volume. These are proven tools that work in most situations. Just make sure to know their limits and always use them in combination, not alone.
Is there a single “best” trading indicator?
Nope. Every indicator has strengths and weaknesses. A good trader knows when to use which one—and when to ignore it. More important than the tool itself is your discipline, testing, and having a trading plan.
What are “chart display indicators”?
They’re visual tools that help you analyze the chart—like trendlines, moving averages, bands, or oscillators. We’ve gone through the most effective ones above, and how to start using them.
Are the best trading indicators available on most platforms?
Yes. Most popular indicators like moving averages, RSI, or MACD are available on nearly all major platforms. It’s not about where you trade—it’s about how you read and use your tools.
How many indicators should I use at once?
Ideally 2–3, each with a different purpose (like trend + oscillator + volume). More than three often leads to confusion. Simplicity = clarity.


