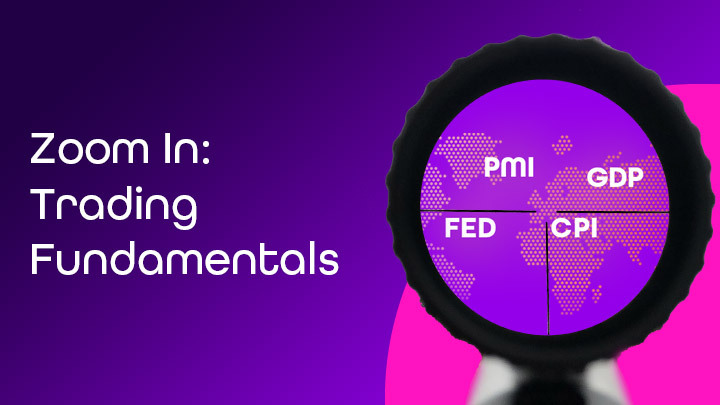
Zoom in: Trading fundamentals: What is PMI and how can it help boost your trading results?
If you want to start trading news, you first need to understand it. No worries—we’ve got your back! That’s exactly what our Fundamentals Spotlight series is for. In this fourth episode, we’re diving into another key indicator that moves the markets: the PMI index.
Fintokei is one of the few prop firms that lets you trade during news releases—no restrictions. So why not take advantage of it? In the last episode, we talked about central banks. This time, we’ll show you how traders track the economy’s vibe using a single number—and how you can use it too!
What is PMI?
PMI (Purchasing Managers’ Index) is an index that measures activity in the manufacturing or services sector. It tells you if the economy is speeding up or slowing down. It’s based on surveys from purchasing managers—people with real insights into how their company and industry are doing.
They evaluate several areas: new orders, production, employment, delivery times, inventories, and more. The key number to watch is 50:
- PMI > 50 = the sector is growing (expanding).
- PMI > 60 = it’s overheating (and not sustainable long-term).
- PMI < 50 = contraction.
- PMI < 45 = serious slowdown, possibly signaling a recession.
What types of PMI are there?
Now you know what PMI is and why it matters. But guess what? There’s more than one type. Let’s break it down so you don’t get lost:
- Manufacturing PMI – tracks activity in the manufacturing sector. Key for industrial economies (Germany, China, Czech Republic).
- Services PMI – tracks activity in the service sector. Crucial for developed economies like the U.S., UK, and Eurozone.
- Composite PMI – combines both manufacturing and services to give an overall economic picture.
- Flash PMI – an early estimate released about a week before the official number. It’s a first sneak peek into the current month—and yes, it moves markets.
Why so many? And how do I keep track?
Some countries (like China and the U.S.) even have multiple PMI versions:
- China:
- Official PMI – published by government agency NBS, focused on large state-owned firms.
- Caixin PMI – targets smaller, private businesses. Want a more realistic picture of China’s economy? Watch this one.
- USA:
- ISM PMI – the rockstar of PMIs. Combines manufacturing, services, and composite indexes. Every trader watches it.
- S&P Global PMI – published by S&P. It’s like the warm-up band before ISM’s main show. Their results can sometimes differ.
Why is PMI such a big deal?
Because it’s one of the first major economic indicators released each month—usually on the 1st. It gives you a fast read on where the economy is headed. Hard data like GDP or unemployment? Great, but lagging. PMI gives you a head start.
💡 Fintokei tip
In the ISM PMI report, pay close attention to the “Prices” component. It often hints at where PCE inflation is headed—the one the Fed watches most closely. If prices start rising fast, it could mean inflation is heating up. And when inflation rises, the Fed steps in with rate hikes. You know what happens next.
How does PMI impact markets?
PMI moves all major markets—from forex and stocks to bonds and commodities. Here’s how traders usually react:
Forex:
Strong U.S. PMI often boosts the dollar. Why? The U.S. economy is service-driven. High PMI = consumers are spending = inflation risk = Fed hikes = stronger dollar. Weak PMI = opposite effect.
Stocks:
High PMI = companies are doing well = more orders, more production, higher profits = traders love it. But too high? Inflation risk again = Fed steps in = higher rates = markets might drop.
Bonds:
High PMI = traders expect inflation and tighter policy = yields may rise.
Commodities:
Copper and oil react heavily to China’s PMI. Strong PMI = higher industrial demand = rising prices.
How to trade PMI like a pro
Watch expectations – If PMI is expected at 48 and comes in at 51, that’s a surprise. It’s not just about the number itself—but how it compares to forecasts. The more extreme the surprise, the bigger the market reaction.
Dig into the details – The headline isn’t everything. PMI might be above 50, but new orders could be dropping. That’s a red flag. In the U.S., check the full ISM report for deeper insights.
Time it right – Flash PMI for the Eurozone is released for Germany and France on the same day. Traders usually react to the first number—everything else just fills in the picture.
Real-life example: Weak services PMI = weaker USD
On July 3, 2024, the ISM Services PMI for June was announced. Forecast was 52.6 (previous month was 53.8). So the market expected solid expansion.

Actual result: 48.8. Below the key 50 level = contraction.
Result? The market got spooked. The service sector is the main engine of the U.S. economy. Weak data pushed traders to bet on Fed rate cuts. The Dollar Index (DXY) dropped over the next few sessions—and so did major USD pairs.